TWAMP
The TWAMP (Two-way Active Measurement Protocol) measurement feature enables users to actively measure various network metrics such as latency, packet loss, and jitter.
netMeter can function as both the sender and responder in TWAMP, allowing you to create a bidirectional measurement setup between the destination and netMeter within your network infrastructure for a comprehensive network performance analysis at a low cost.
⚠︎Notice: At its current stage, netMeter supports only TWAMP Light mode (UDP).
TWAMP : Sender Mode
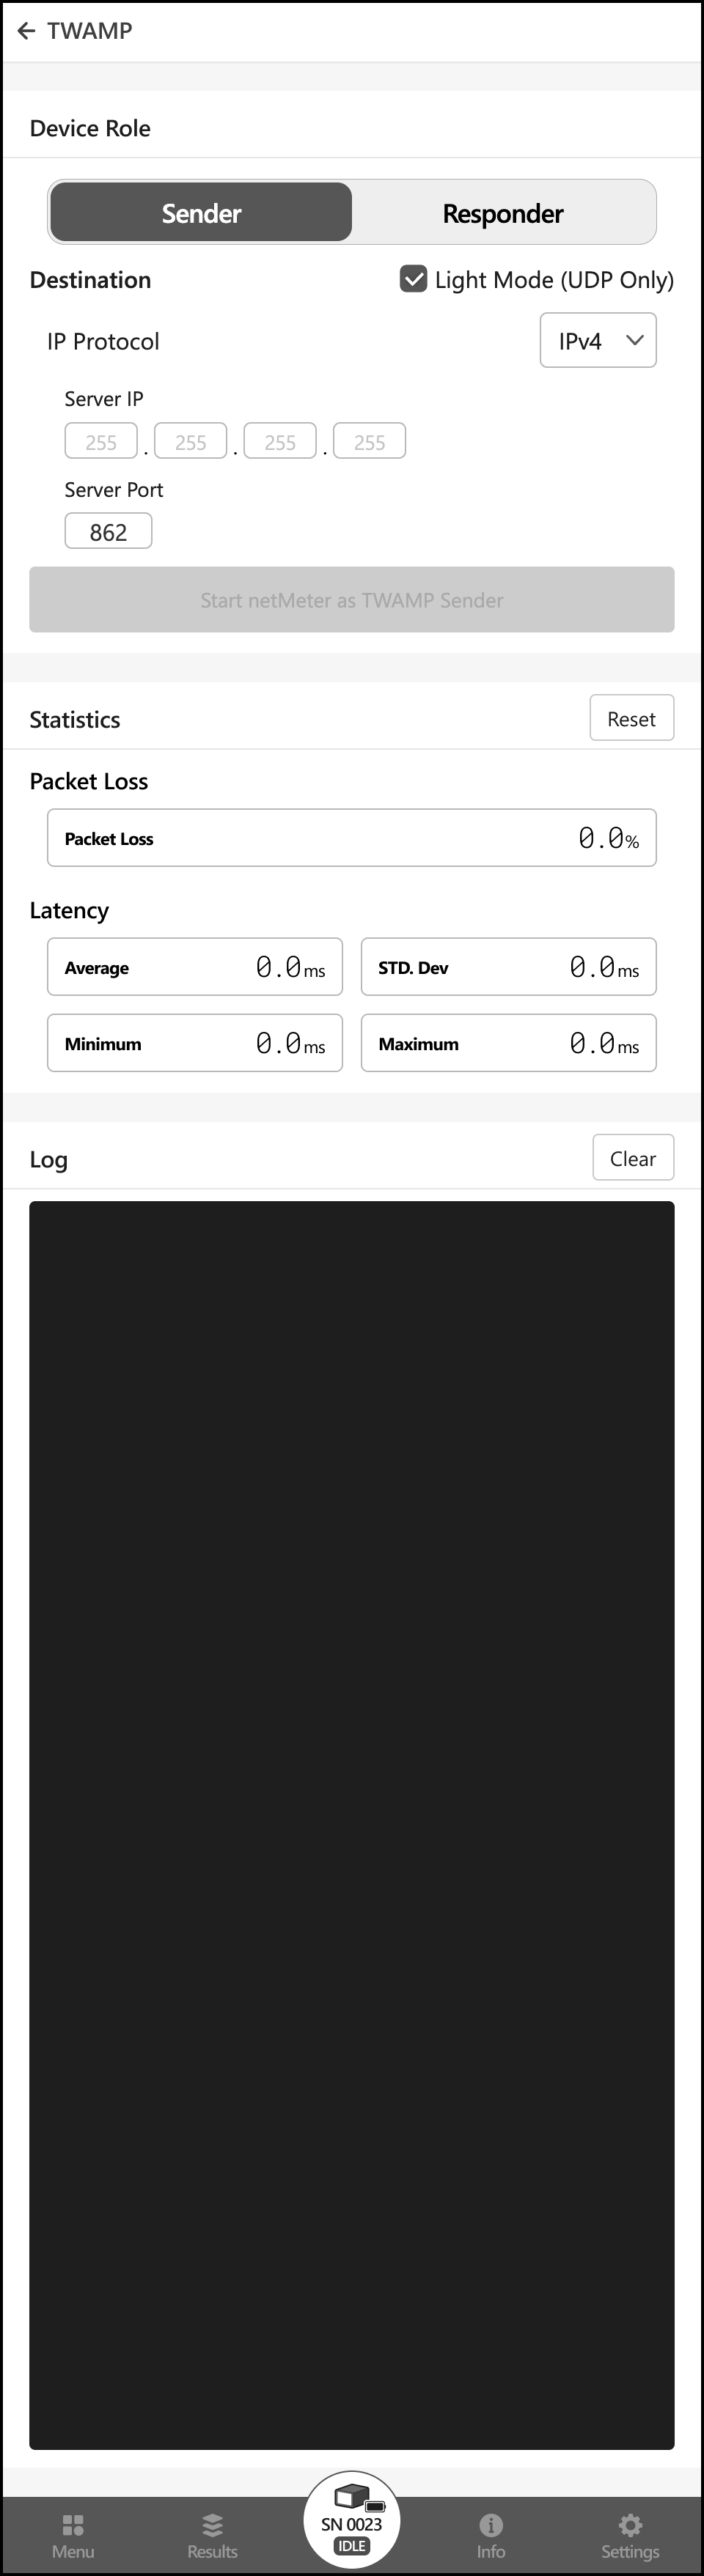
Destination
Specify the destination IP address and port to send packets as the sender role
The default port for TWAMP is set to 862.
Can be adjusted according to network conditions and the TWAMP configuration of the "Responder" device.
When the user presses the start button, netMeter will initiate a TWAMP sequence to the designated destination.
The default TWAMP sending sequence configuration is set to the following conditions and can be configurable via Organization Settings for B2B purposes.
- Number of packets to send: 100
- MTU: 1500 Bytes
- Payload: 1472 Bytes
- Interval: 10 s
- TTL: 64 Hops
Statistics
View detailed statistics generated from the TWAMP measurements, including:
- Packet Loss: Percentage of packets lost during transmission.
- Average Latency: Mean round-trip time for data packets.
- Standard Deviation: Measure of the dispersion of latency values around the mean.
- Minimum Latency: Shortest round-trip time observed during measurements.
- Maximum Latency: Longest round-trip time observed during measurements.
Pressing the "Reset" button will reset the statistics and begin recalculating them from the moment it is pressed. This action does not affect the statistics that will be uploaded and displayed in the results history.
Log
Log lines will be displayed in real-time, containing detailed information about ongoing TWAMP measurements. Pressing the "Clear" button will clear the loglines.
TWAMP : Responder Mode
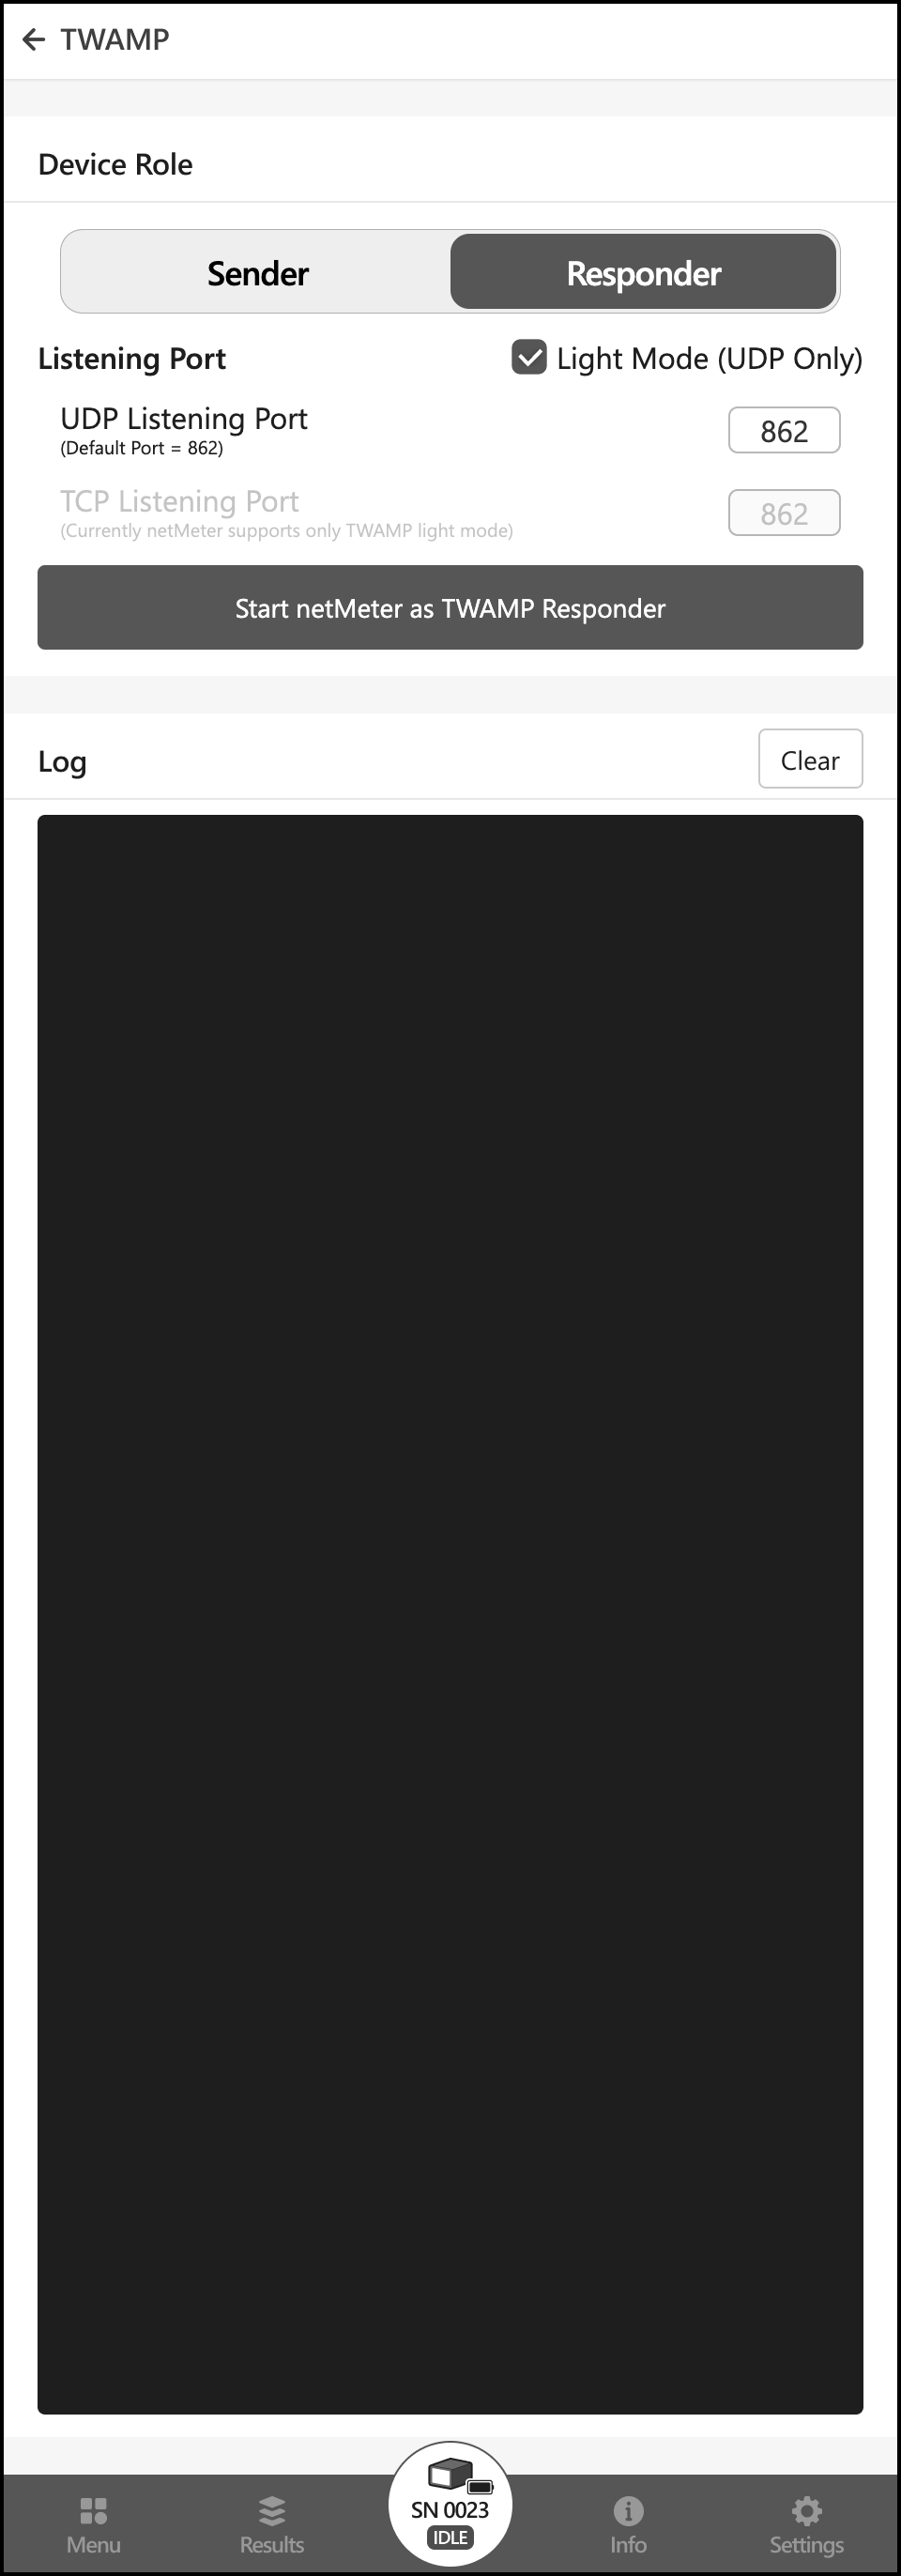
Listening Port
Specify the port number on which the TWAMP responder will listen for incoming TWAMP test packets.
The default port for TWAMP is set to 862.
Can be adjusted according to TWAMP configuration of the "Sender" device or network conditions.
When the user presses the start button, netMeter will start as a TWAMP responder server. The IP address and port of the netMeter will be displayed on the button. This information can be used as the destination for senders.
Log
Log lines will be displayed in real-time, containing detailed information about ongoing TWAMP measurements. Pressing the "Clear" button will clear the loglines.
Results History
⚠︎Notice: TWAMP Responder Mode does not register measurement history.
When the measurement is complete, netMeter automatically uploads the measurement results to the server. You can access measurement records and details at any time through the 'Results' tab at the bottom of the screen.